If you’ve ever managed reporting in your organization, you know how manual and repetitive the process can be—prone to delays, errors, and bottlenecks as you and your team wrangle data from scattered sources and spend hours turning raw information into usable insights. The core challenge is organizing access to data in a way that’s reliable, scalable, and context-aware — ensuring you consistently gather, process, and present all required metrics with minimal friction.
AI agents can help you solve this. These systems use advanced AI models—such as large language models (LLMs) or large reasoning models (LRMs) — and retrieval techniques (from SQL or Vector Data or Timeseries Data and so on) to autonomously access, synthesize, and interpret data from multiple sources. When it comes to report generation, AI agents can dynamically query your databases and APIs, apply domain-specific business rules, and generate well-structured, context-rich reports in natural language, tailored to your audience’s needs.
By automating the entire reporting pipeline—from secure data access and processing to analytics and delivery — autonomous AI agents help you eliminate manual work and scale insights across your teams with unprecedented speed and consistency. This not only shortens your reporting cycles but also reduces errors and ensures your reports are always built on the latest available data.
In this deep dive, you’ll learn how to break down the architecture, design patterns, and practical steps for building autonomous report generation agents — transforming report creation from a static, manual workflow into a flexible, intelligent service.
A Business Case for Using AI Agents to Create Reports
If you’re responsible for reporting, you already know it’s essential but resource-intensive. Recent industry studies show that you and your data teams could be spending up to 50–80% of your time on data preparation and report creation—leaving less time for analysis and strategic work. Manual reporting doesn’t just consume valuable time; it also brings risk: according to Gartner, over 60% of business leaders have made decisions based on outdated or incomplete reports at least once in the past year.
Here’s why reporting often becomes time-consuming and error-prone for you:
- Fragmented Data Sources: Your data might be scattered across multiple databases, cloud apps, and spreadsheets, making aggregation and reconciliation tedious.
- Manual Data Preparation: You have to clean, normalize, and map data for reports repeatedly, increasing the risk of inconsistencies and mistakes.
- Complex Business Logic: You need to apply and update business rules, KPIs, and compliance requirements manually—making errors or using outdated logic all too easy.
- Static, One-Size-Fits-All Templates: It’s difficult to adapt reports to different audiences or changing business needs without significant rework.
- Limited Real-Time Visibility: Manual processes make it hard to ensure your reports reflect the latest data, raising the risk of decisions based on stale or incomplete information.
The biggest challenge around reporting is around data gathering and data consolidation, and not the actual report creation. This is what AI agents can help solve for your organization.
AI Agents - A Technical Deep-Dive
To truly unlock the power of autonomous reporting, you need to understand how AI agents work under the hood. These aren’t just rule-based bots anymore — they’re systems that combine large language models (LLMs), robust retrieval pipelines, orchestration logic, and secure integrations to autonomously manage the full reporting workflow.
At a high level, an AI report generation agent typically includes:
- Data Connectors: Modules that securely connect to your databases, cloud apps, spreadsheets, or APIs to pull in raw data as needed.
- Orchestration Engine: The agent’s brain, which decides when to fetch data, trigger analyses, generate drafts, and deliver reports — either on a schedule or in response to events.
- Analysis and Business Logic Layer: Where your rules, calculations, KPIs, and compliance checks are encoded, either through traditional logic or with LLM-powered reasoning for more dynamic scenarios.
- Natural Language Generation (NLG): The engine (often built with advanced LLMs) that transforms structured data and insights into readable, tailored narratives.
- Output and Delivery Pipeline: Components that format the report (PDF, HTML, email, Slack, dashboards, etc.) and deliver it to your stakeholders automatically.
- Feedback Loop: Mechanisms for users to review, correct, and fine-tune both the data and the narratives, ensuring the agent continues to learn and improve over time.
By orchestrating all these elements, AI agents can continuously deliver accurate, timely, and actionable reports — with minimal input required from you.
Choosing the Right Path: Agent Platforms vs Custom-Built AI Agents
When you set out to deploy autonomous report generation agents, one of your first decisions is whether to use an off-the-shelf agent platform or to build your own custom agent from the ground up.
Agent Platforms
Agent platforms like Dust, Lyzr, n8n and others offer pre-built frameworks, integrations, and tools designed to accelerate development and deployment. These platforms often come with drag-and-drop interfaces, preconfigured connectors to popular data sources, built-in security, and templated workflows. You can get up and running quickly — perfect if your reporting needs align closely with what the platform offers.
Pros:
- Fast time-to-value with minimal engineering effort
- Built-in best practices for security and compliance
- Maintenance, updates, and scalability handled by the platform provider
- Access to community support and integrations
Cons:
- Limited flexibility for highly specific or unique business logic
- Customization may be constrained by platform capabilities
- Vendor lock-in can become a concern as your needs evolve, and this translates into higher cost in the long run
- Quality of the agent performance will vary widely depending on the platform
- Might be a challenge if you have sensitive data that you want to protect
Custom-Built Agents
If you need more control, flexibility, or want to deeply tailor the agent’s logic, a custom-built approach lets you design every component to your exact requirements. You can choose your tech stack, data models, business rules, and NLG strategies, and fully integrate with your existing systems.
Pros:
- Complete flexibility to encode your domain-specific rules and workflows
- Ability to integrate with any data source or delivery channel
- No vendor lock-in—full ownership of your code and IP
- Can optimize for performance, cost, or compliance as needed
- Data stays in your cloud, and you retain full control and privacy
- Full control on quality, precision and accuracy
Cons:
- Higher upfront engineering effort and complexity
- Ongoing maintenance, updates, and security are your responsibility
- Longer time to initial deployment
Which Should You Choose?
In our experience, we have seen that organizations often start with agent platforms for their speed and convenience, but soon realize that vendor lock-in, long-term costs, and accuracy challenges can become significant obstacles. As your requirements evolve — whether it’s the need for deeper integration, more advanced business logic, or greater control over data handling — platform limitations can hinder your ability to adapt and optimize.
Custom-built agents, while requiring more upfront investment and technical expertise, give you full ownership and control. You’re free to fine-tune accuracy, tailor workflows, and scale your solution without depending on external vendors or being surprised by rising platform fees.
If you’re looking for quick validation or have simple, standard reporting needs, starting with an agent platform makes sense. But if your goal is long-term flexibility, differentiation, and cost control, investing in custom-built AI agents is often the more sustainable and strategic path.
Steps to Build a Report Generation Agent
Below, we will build a custom report generation agent that taps into two data sources - PostgreSQL and existing documents - in order to generate a report on the fly. We will use PydanticAI as our agentic orchestration framework.
PydanticAI provides a clean, structured way to build AI agents by defining inputs, outputs, and tool functions as strongly typed Python models.
This makes it ideal for production-grade reporting agents because:
- Your inputs and outputs are validated before execution, reducing runtime errors.
- Business rules and data transformations are explicitly encoded in your type models.
- Integrations with databases, APIs, and retrieval pipelines can be wrapped as “tools” that the agent selectively calls.
- It’s LLM-agnostic — you can use OpenAI, Anthropic, or self-hosted models.
Let’s start.
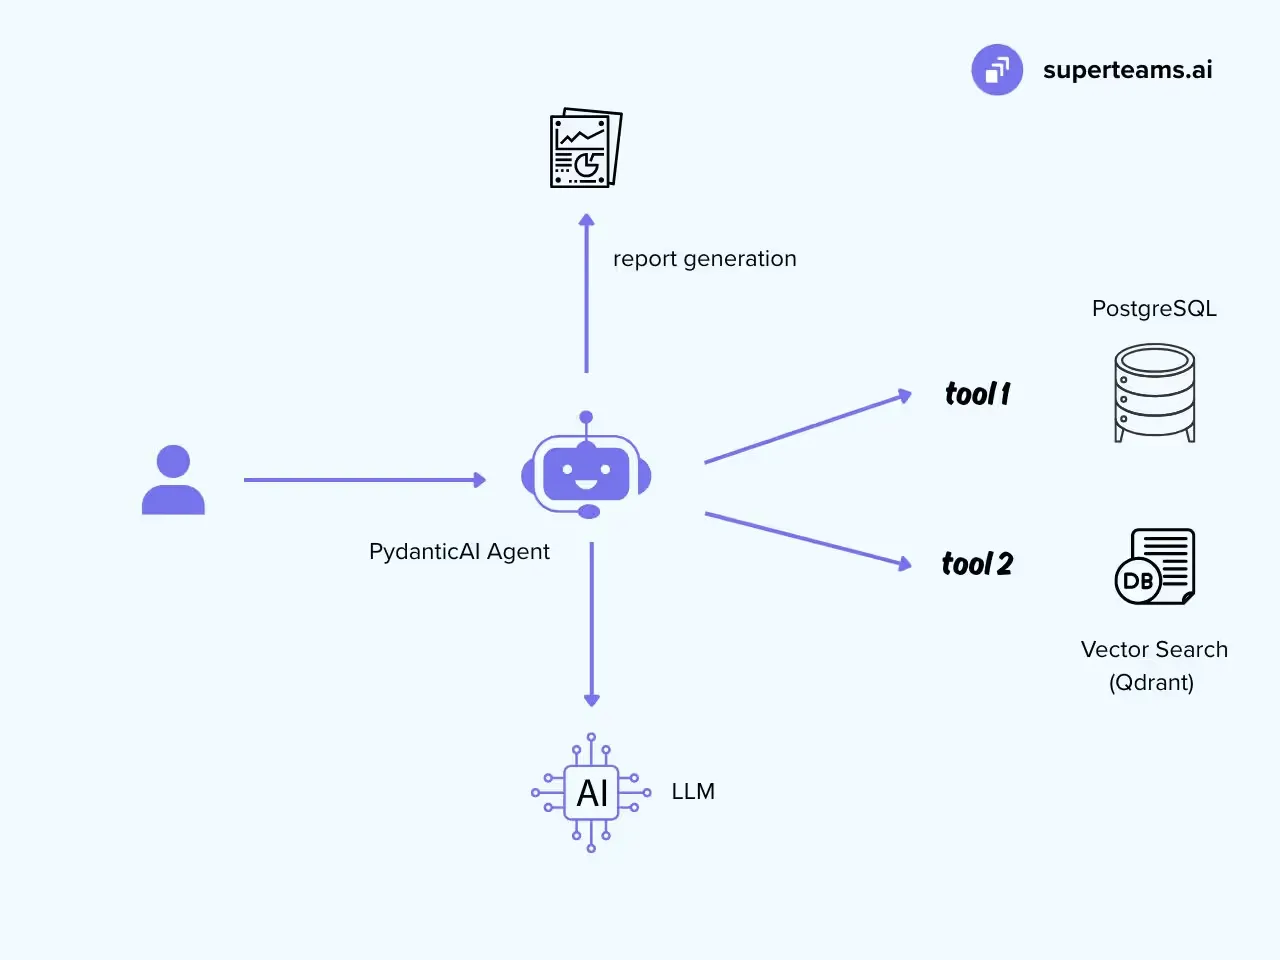
1- The Agent Workflow
We want our reporting agent to:
- Accept a reporting request (e.g., “Generate weekly sales report”).
- Pull relevant structured data from PostgreSQL.
- Fetch unstructured reference documents from a vector store (e.g., Qdrant).
- Apply business logic (KPIs, compliance rules).
- Generate a natural language report.
- Return it in a nicely formatted and designed way.
Here’s the architecture diagram for this:
2- Seed Data
Below is a minimal but realistic dataset for a weekly sales report. It includes customers, products, and orders; a materialized view computes KPIs so your agent fetch is fast and predictable.
Let’s first create the database:
CREATE DATABASE salesdb;
\c salesdb;
Next let’s create tables and insert data:
CREATE TABLE customers (
  customer_id SERIAL PRIMARY KEY,
  name        TEXT NOT NULL,
  region      TEXT NOT NULL CHECK (region IN ('NA','EU','APAC','MEA','LATAM')),
  created_at  TIMESTAMPTZ DEFAULT now()
);


CREATE TABLE products (
  product_id  SERIAL PRIMARY KEY,
  sku         TEXT UNIQUE NOT NULL,
  name        TEXT NOT NULL,
  category    TEXT NOT NULL,
  price_cents INT  NOT NULL CHECK (price_cents > 0)
);


CREATE TABLE orders (
  order_id     SERIAL PRIMARY KEY,
  customer_id  INT NOT NULL REFERENCES customers(customer_id),
  product_id   INT NOT NULL REFERENCES products(product_id),
  qty          INT NOT NULL CHECK (qty > 0),
  discount_pct NUMERIC(5,2) NOT NULL DEFAULT 0.0 CHECK (discount_pct >= 0 AND discount_pct <= 100),
  order_ts     TIMESTAMPTZ NOT NULL DEFAULT now()
);


INSERT INTO customers (name, region) VALUES
('Acme Retail', 'NA'),
('Nordlicht GmbH', 'EU'),
('Shimada KK', 'APAC'),
('Sahara Trading', 'MEA'),
('LatAm Partners', 'LATAM');


INSERT INTO products (sku, name, category, price_cents) VALUES
('SKU-ALPHA', 'Alpha Widget', 'Widgets', 1999),
('SKU-BETA' , 'Beta Widget' , 'Widgets', 2999),
('SKU-GAMMA', 'Gamma Add-on', 'Add-ons', 999);


INSERT INTO orders (customer_id, product_id, qty, discount_pct, order_ts) VALUES
(1, 1, 10, 5.0,  now() - INTERVAL '10 days'),
(2, 2,  6, 0.0,  now() - INTERVAL '9 days'),
(3, 3, 25, 0.0,  now() - INTERVAL '8 days'),
(1, 2,  4, 0.0,  now() - INTERVAL '6 days'),
(4, 1,  7, 2.5,  now() - INTERVAL '6 days'),
(5, 1,  3, 0.0,  now() - INTERVAL '5 days'),
(2, 3, 18, 0.0,  now() - INTERVAL '3 days'),
(3, 2,  5, 0.0,  now() - INTERVAL '2 days'),
(1, 3, 30, 0.0,  now() - INTERVAL '1 day');


CREATE OR REPLACE VIEW v_order_lines AS
SELECT
  o.order_id,
  o.order_ts::date AS order_date,
  c.region,
  p.category,
  p.sku,
  (p.price_cents * o.qty * (1 - o.discount_pct/100.0))::bigint AS net_cents,
  o.qty
FROM orders o
JOIN customers c ON c.customer_id = o.customer_id
JOIN products  p ON p.product_id  = o.product_id;


CREATE MATERIALIZED VIEW mv_weekly_kpis AS
SELECT
  date_trunc('week', order_date)::date AS week_start,
  COUNT(DISTINCT order_id)              AS orders_count,
  SUM(net_cents)                        AS revenue_cents,
  SUM(qty)                              AS units_sold,
  ROUND(AVG(net_cents)::numeric,2)      AS avg_order_value_cents
FROM v_order_lines
GROUP BY 1
ORDER BY 1 DESC;
CREATE UNIQUE INDEX ON mv_weekly_kpis(week_start);
Next, we will start Qdrant and load data. This is how you start it:
docker run -p 6333:6333 -p 6334:6334 \
-v "$(pwd)/qdrant_storage:/qdrant/storage:z" \
   qdrant/qdrant
Then install these dependencies:
pip install pydantic-ai qdrant-client psycopg2-binary openai jinja2 python-dotenv
Also, it’s a good practice to create a .env to save your keys:
OPENAI_API_KEY=sk-...
DATABASE_URL=postgresql://report_user:securepass@localhost:5432/salesdb
QDRANT_HOST=localhost
QDRANT_PORT=6333
Now, let’s create collection and upsert docs:
# qdrant_seed.py
import os
from typing import List
from uuid import uuid4

# choose ONE of these paths:
USE_OPENAI = True  # set False to use local embeddings

if USE_OPENAI:
    from openai import OpenAI
    client = OpenAI(api_key=os.getenv("OPENAI_API_KEY"))
    def embed(texts: List[str]) -> List[List[float]]:
        resp = client.embeddings.create(
            model="text-embedding-3-large",
            input=texts
        )
        return [d.embedding for d in resp.data]
else:
    # local embeddings
    from sentence_transformers import SentenceTransformer
    _m = SentenceTransformer("all-MiniLM-L6-v2")
    def embed(texts: List[str]) -> List[List[float]]:
        return _m.encode(texts, convert_to_numpy=False).tolist()

from qdrant_client import QdrantClient
from qdrant_client.models import Distance, VectorParams, PointStruct

docs = [
    {
        "title": "Discount Policy FY25",
        "text": "Standard discounts up to 5% require manager approval; above 10% need VP sign-off. Quarterly promos cannot overlap with partner rebates.",
        "tags": ["policy","pricing"]
    },
    {
        "title": "SLA Excerpt - Order to Cash",
        "text": "Orders must be invoiced within 24 hours of fulfillment. APAC has a cutoff at 18:00 local time for same-day processing.",
        "tags": ["sla","finance"]
    },
    {
        "title": "Q3 Strategy Notes",
        "text": "Shift focus to upselling Beta Widget in EU and APAC; bundle Gamma Add-on. Target +12% AOV via bundles.",
        "tags": ["strategy","sales"]
    },
    {
        "title": "Compliance: Regional Rules",
        "text": "MEA requires export docs archived for 7 years. LATAM invoices must include local tax codes and electronic signatures.",
        "tags": ["compliance","regional"]
    }
]

client_q = QdrantClient(host="localhost", port=6333)

# create collection if missing
COLL = "report_refs"
if COLL not in [c.name for c in client_q.get_collections().collections]:
    client_q.create_collection(
        collection_name=COLL,
        vectors_config=VectorParams(size=len(embed(["dim_probe"])[0]), distance=Distance.COSINE)
    )

texts = [d["text"] for d in docs]
vecs = embed(texts)

points = [
    PointStruct(
        id=str(uuid4()),
        vector=vecs[i],
        payload={"title": docs[i]["title"], "text": docs[i]["text"], "tags": docs[i]["tags"]}
    )
    for i in range(len(docs))
]

client_q.upsert(collection_name=COLL, points=points)
print("Seeded Qdrant with", len(points), "docs.")
3- Vector Search Helper
Now we will create a helper function that uses vector search to find the right text documents:
# qdrant_search.py
from qdrant_client import QdrantClient
from typing import List

def semantic_search(query: str, top_k: int = 5) -> List[dict]:
    # match the embedding function you used to seed
    from openai import OpenAI
    import os
    client = OpenAI(api_key=os.getenv("OPENAI_API_KEY"))
    emb = client.embeddings.create(model="text-embedding-3-large", input=[query]).data[0].embedding

    q = QdrantClient(host="localhost", port=6333)
    res = q.search(collection_name="report_refs", query_vector=emb, limit=top_k)
    return [{"title": r.payload["title"], "text": r.payload["text"], "score": float(r.score)} for r in res]
Note: We are not using filters in the above query. However, in most cases, you may end up having to use filters. To do that, use structured outputs to generate Qdrant filter query from natural language.
4- Create a View
Agents behave best when data shaping is already done at the SQL level. Let’s create a view that the agent can use:
CREATE OR REPLACE VIEW v_weekly_dashboard AS
SELECT
  w.week_start,
  w.orders_count,
  ROUND(w.revenue_cents/100.0, 2)      AS revenue_usd, -- or your currency
  w.units_sold,
  ROUND(w.avg_order_value_cents/100.0,2) AS avg_order_value
FROM mv_weekly_kpis w
ORDER BY w.week_start DESC;
5- Agent Tools
Now create Pydantic schemas:
# agent_schemas.py (part 1)
from typing import List, Dict, Optional
from pydantic import BaseModel, Field

class ReportRequest(BaseModel):
    report_type: str = Field(description="e.g., 'weekly_sales'")
    period_start: str = Field(description="ISO date, inclusive")
    period_end: str   = Field(description="ISO date, inclusive")
    audience: Optional[str] = Field(default="exec", description="exec|ops|sales")

class KPI(BaseModel):
    name: str
    value: float | int | str
    unit: Optional[str] = None
    target: Optional[float] = None
    status: Optional[str] = None  # ok|warn|fail

class ReportOutput(BaseModel):
    summary_text: str
    kpis: List[KPI]
    references: List[str]
    rendered_html: str
    sources_used: List[str]
Now create a few tools:
# db.py
import os
import psycopg2
from contextlib import contextmanager

DATABASE_URL = os.getenv("DATABASE_URL", "postgresql://localhost:5432/salesdb")

@contextmanager
def pg_conn():
    conn = psycopg2.connect(DATABASE_URL)
    try:
        yield conn
    finally:
        conn.close()

def refresh_weekly_mv():
    with pg_conn() as conn, conn.cursor() as cur:
        cur.execute("REFRESH MATERIALIZED VIEW CONCURRENTLY mv_weekly_kpis;")
        conn.commit()

def fetch_week_window(period_start: str, period_end: str):
    """
    Returns the single week row whose week_start falls inside the requested window.
    Adjust to your own windowing logic if needed.
    """
    sql = """
      SELECT week_start, orders_count, revenue_cents, units_sold, avg_order_value_cents
      FROM mv_weekly_kpis
      WHERE week_start >= %s::date AND week_start <= %s::date
      ORDER BY week_start DESC
      LIMIT 1;
    """
    with pg_conn() as conn, conn.cursor() as cur:
        cur.execute(sql, (period_start, period_end))
        row = cur.fetchone()
    if not row:
        return None
    return {
        "week_start": row[0].isoformat(),
        "orders_count": row[1],
        "revenue_usd": round(row[2] / 100.0, 2),
        "units_sold": row[3],
        "avg_order_value": round(row[4] / 100.0, 2),
And also a tool to perform Business KPI check
# rules.py
from typing import Dict, List
from agent_schemas import KPI

def evaluate_kpis(raw: Dict, audience: str = "exec") -> List[KPI]:
    """
    Example thresholding; in practice pull targets from a config table.
    """
    targets = {
        "revenue_usd": 5000.0,
        "orders_count": 20,
        "avg_order_value": 60.0
    }
    kpis = []

    def status(val, tgt):
        if tgt is None: return None
        if val is None: return "warn"
        if val >= tgt: return "ok"
        if val >= 0.9 * tgt: return "warn"
        return "fail"

    kpis.append(KPI(
        name="Revenue", value=raw["revenue_usd"], unit="USD",
        target=targets["revenue_usd"], status=status(raw["revenue_usd"], targets["revenue_usd"])
    ))
    kpis.append(KPI(
        name="Orders", value=raw["orders_count"],
        target=targets["orders_count"], status=status(raw["orders_count"], targets["orders_count"])
    ))
    kpis.append(KPI(
        name="Units Sold", value=raw["units_sold"]
    ))
    kpis.append(KPI(
        name="Avg Order Value", value=raw["avg_order_value"], unit="USD",
        target=targets["avg_order_value"], status=status(raw["avg_order_value"], targets["avg_order_value"])
    ))
    return kpis
6- Report Template
Let’s also create a report template that we can use:
# renderer.py
from jinja2 import Template

TEMPLATE = Template("""
<!doctype html>
<html>
<head>
  <meta charset="utf-8" />
  <title>{{ title }}</title>
  <style>
    body { font-family: ui-sans-serif, system-ui, -apple-system, Segoe UI, Roboto, Arial; margin: 24px; color: #0f172a; }
    .card { border: 1px solid #e5e7eb; border-radius: 12px; padding: 16px; margin-bottom: 16px; }
    .kpis { display: grid; grid-template-columns: repeat(4, minmax(0, 1fr)); gap: 12px; }
    .kpi  { background: #f8fafc; border-radius: 10px; padding: 12px; text-align: center; }
    h1 { font-size: 22px; margin: 0 0 12px; }
    h2 { font-size: 16px; margin: 8px 0; }
    .muted { color: #64748b; font-size: 12px; }
    .ok { color: #16a34a; } .warn { color: #d97706; } .fail { color: #dc2626; }
  </style>
</head>
<body>
  <h1>{{ title }}</h1>
  <div class="muted">Period: {{ start }} → {{ end }}</div>

  <div class="card">
    <h2>Key Metrics</h2>
    <div class="kpis">
      {% for k in kpis %}
        <div class="kpi">
          <div class="muted">{{ k.name }}</div>
          <div>
            <strong>{{ k.value }}{% if k.unit %} {{ k.unit }}{% endif %}</strong>
            {% if k.status %}<span class="{{ k.status }}">({{ k.status }})</span>{% endif %}
          </div>
          {% if k.target is not none %}
            <div class="muted">Target: {{ k.target }}{% if k.unit %} {{ k.unit }}{% endif %}</div>
          {% endif %}
        </div>
      {% endfor %}
    </div>
  </div>

  <div class="card">
    <h2>Highlights</h2>
    <ul>
      {% for line in highlights %}<li>{{ line }}</li>{% endfor %}
    </ul>
  </div>

  <div class="card">
    <h2>Notes & Policies Referenced</h2>
    <ul>
      {% for ref in references %}<li>{{ ref }}</li>{% endfor %}
    </ul>
  </div>
</body>
</html>
""".lstrip())

def render_html(title: str, start: str, end: str, kpis, highlights, references) -> str:
    return TEMPLATE.render(
        title=title, start=start, end=end, kpis=kpis, highlights=highlights, references=references
    )
7- Agent Workflow
Finally, let’s create an agentic workflow using PydanticAI, which makes it easy for us to orchestrate the agent. We’ll use OpenAI’s latest model GPT 5:
from typing import List
from pydantic import BaseModel
import os
from typing import List
from pydantic_ai import Agent, Tool  # PydanticAI core
from pydantic import BaseModel
from openai import OpenAI
from db import refresh_weekly_mv, fetch_week_window
from qdrant_search import semantic_search
from rules import evaluate_kpis
from renderer import render_html
from agent_schemas import ReportRequest, ReportOutput


# ---- model config (LLM-agnostic) --------------------------------------------
OPENAI_MODEL = os.getenv("OPENAI_MODEL", "gpt-5")
openai_client = OpenAI(api_key=os.getenv("OPENAI_API_KEY"))

# ---- tools ------------------------------------------------------------------
@Tool
def tool_refresh_materialized_view() -> str:
    """Refresh KPI materialized view for up-to-date metrics."""
    refresh_weekly_mv()
    return "refreshed"

class FetchKPIInput(BaseModel):
    period_start: str
    period_end: str

@Tool
def tool_fetch_weekly_kpis(inp: FetchKPIInput) -> dict:
    """Return a canonical dict of weekly KPIs for the window."""
    row = fetch_week_window(inp.period_start, inp.period_end)
    return row or {}

class SearchRefsInput(BaseModel):
    query: str
    top_k: int = 4

@Tool
def tool_search_refs(inp: SearchRefsInput) -> List[dict]:
    """Semantic search over reference knowledge in Qdrant."""
    return semantic_search(inp.query, top_k=inp.top_k)

# ---- agent definition --------------------------------------------------------
SYSTEM_INSTRUCTIONS = """
You are a reporting agent. Always:
- Refresh the KPI materialized view if the period overlaps 'this week' or 'recent days'.
- Fetch KPIs from the canonical tool; DO NOT invent metrics.
- Use reference search to ground narrative with policy/strategy notes when relevant.
- Produce a succinct summary for exec audience by default.
- Return both structured KPIs and an HTML report string.
"""

agent = Agent[ReportRequest, ReportOutput](
    name="report_gen_agent",
    instructions=SYSTEM_INSTRUCTIONS,
    tools=[tool_refresh_materialized_view, tool_fetch_weekly_kpis, tool_search_refs],
    model=OPENAI_MODEL,  # swap to your provider as needed
)

# ---- run function ------------------------------------------------------------
def run_report(req: ReportRequest) -> ReportOutput:
    """
    Orchestrates a single-shot run:
    1) Ask the LLM to decide which tools to call (PydanticAI handles tool routing).
    2) Post-process with deterministic KPI rules and rendering.
    """
    # 1) Use tools to get raw KPI dict & references
    #    (You can also choose to call tools directly for tighter control.)
    raw = fetch_week_window(req.period_start, req.period_end)  # deterministic path
    if raw is None:
        # Try refreshing and retry once
        refresh_weekly_mv()
        raw = fetch_week_window(req.period_start, req.period_end)

    refs = semantic_search(f"{req.report_type} highlights for period {req.period_start} to {req.period_end}", top_k=4)

    # 2) Apply business rules
    kpis = evaluate_kpis(raw, audience=req.audience if raw else "exec") if raw else []

    # 3) Draft a narrative (LLM) using structured context
    #    You can replace with any provider--keep prompt compact & explicit.
    prompt = f"""
Draft a concise weekly sales report narrative for executives.
Data (JSON): {raw}
Audience: {req.audience}
Reference snippets (titles + text): {refs}
Focus on signal, not noise. Avoid inventing numbers; cite policies/notes qualitatively.
"""
    completion = openai_client.chat.completions.create(
        model=OPENAI_MODEL,
        messages=[{"role": "system", "content": "You are a precise reporting assistant."},
                  {"role": "user", "content": prompt}],
    )
    summary = completion.choices[0].message.content.strip()

    # 4) Build highlights & references for renderer
    highlights = []
    if raw:
        highlights.append(f"Revenue: ${raw['revenue_usd']:,}")
        highlights.append(f"Orders: {raw['orders_count']}")
        highlights.append(f"Avg Order Value: ${raw['avg_order_value']}")
    if refs:
        highlights.append("Applied current discount/SLA/strategy guidelines as relevant.")

    references = [f"{r['title']}" for r in refs]

    # 5) Render HTML
    html = render_html(
        title="Weekly Sales Report",
        start=req.period_start,
        end=req.period_end,
        kpis=[k.model_dump() for k in kpis],
        highlights=highlights,
        references=references
    )

    # 6) Return typed output
    return ReportOutput(
        summary_text=summary,
        kpis=kpis,
        references=references,
        rendered_html=html,
        sources_used=["postgres.mv_weekly_kpis", "qdrant.report_refs"]
8- Run It!
That’s it (for a basic report generation system) - you can now run it.
# report_agent.py
from agent_tools import ReportRequest, run_report

if __name__ == "__main__":
   # Example: last 7 days window; tweak as needed
   req = ReportRequest(
       report_type="weekly_sales",
       period_start="2025-08-04",
       period_end="2025-08-10",
       audience="exec"
   )
   out = run_report(req)

   # Save HTML for preview/PDF conversion
   out_path = "weekly_report.html"
   with open(out_path, "w", encoding="utf-8") as f:
       f.write(out.rendered_html)

   print("\n--- SUMMARY ---\n")
   print(out.summary_text)
   print("\nSaved HTML ->", out_path)
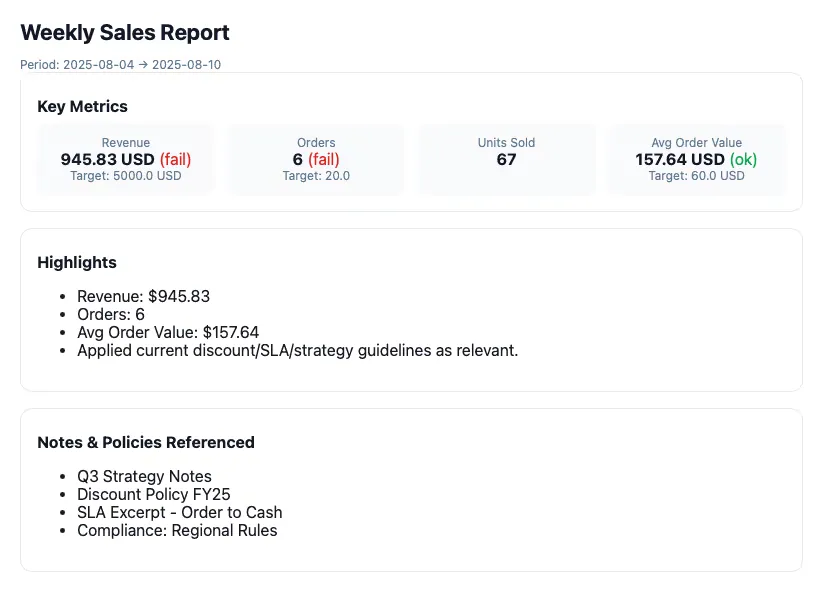
Run it like this:
python report_agent.pyThat’s it. You will see a report generated like the image below. You can improve the template and make it as complex/sophisticated as you want based on your company needs.
Production Considerations
Shipping a demo is easy; running reporting agents in production week after week is a different game. Use this checklist to harden reliability, security, quality, and cost.
Security & Data Governance
- Least-privilege DB roles: create a read-only user scoped to views used by the agent. Prefer parameterized views over ad-hoc SQL.
- RLS / tenant isolation: if multi-tenant, enforce row-level security on base tables or secure views; don’t rely on the agent to filter.
- Network boundaries: restrict DB/VDB to private subnets/VPC; use TLS for Postgres and Qdrant; rotate credentials.
- PII safety: redact before logging or sending to an external LLM. Add a scrubber to all tool outputs and agent logs.
Reliability & Resilience
- Timeouts & circuit breakers: hard limits for DB queries, vector search, and LLM calls. Fail fast, degrade gracefully.
- Retries with jitter: retry transient failures (429, 5xx) with exponential backoff; never retry on validation errors.
- Idempotency: key report runs by (report_type, period_start, period_end, tenant); upsert results so replays don’t duplicate.
- Fallbacks: if LLM fails, return a minimal HTML report with KPIs only; if Qdrant fails, skip references and flag in the output.
- Canary & rollback: deploy new prompts/versions to 5–10% of tenants; keep previous agent+prompt version ready to roll back.
Observability & Auditability
- Structured logs: log per tool call: tenant, report_id, tool, latency_ms, status, cost_tokens.
- Tracing: propagate a trace_id from HTTP → agent → tools → DB/VDB. Use OpenTelemetry if available.
- Result registry: store inputs, outputs, html, source_hashes, and prompt_version for each run (enables diffing & audits).
- Data lineage: record the exact SQL/view name, MV refresh status, and Qdrant collection/version used.
Quality, Guardrails & Evals
- Prompt versioning: keep a prompt registry; bump semver when prompts or tools change; pin by tenant if needed.
- Guardrails: schema validation (Pydantic) + business rules (bounds/monotonicity checks). Refuse to emit if numbers don’t reconcile.
- Automated evals:
- Deterministic: SQL KPI correctness vs. known fixtures.
- Stochastic: narrative coherence/grounding using a judge model over hidden holdout periods.
- Regression: compare new vs. baseline for hallucination rate, reference usage, and fact match.
Change Management (Data, Model, Prompt)
- Schema drift: protect with views; never let agents query raw tables. Contract tests fail builds if view columns change.
- Model upgrades: shadow traffic and compare outputs; only switch default after evals pass.
- Prompt changes: canary by tenant; auto-revert if quality metrics dip beyond SLOs.
Delivery & UX
- Formats: HTML (email/web), PDF (board packs), JSON (APIs). Always include a machine-readable block for downstream systems.
- Trust cues: show “Data as of …” and the source view names (for verification); link to raw numbers drill-down if authorized.
Human-in-the-loop: allow comments/corrections; feed back confirmed edits into a supervised “style & accuracy” memory.
Conclusion
Autonomous AI-powered report generation can be a multiplier for decision-making speed, accuracy, and scalability. By combining structured data from sources like PostgreSQL, contextual knowledge from vector stores such as Qdrant, and orchestration frameworks like PydanticAI, you can transform reporting from a slow, error-prone chore into a fast, repeatable, and high-trust process.
The technical building blocks we’ve explored — typed contracts, reliable data connectors, embedded business rules, and secure production practices — make it possible to deliver insights that are both timely and trustworthy. More importantly, once this reporting foundation is in place, the same architecture can be extended to other domains: customer insights, compliance monitoring, operational health checks, or even fully automated business reviews.
But designing, building, and productionizing systems like this isn’t trivial. You need the right mix of AI engineering, data architecture, and operational discipline to make it work — fast, and without disrupting your existing workflows.
That’s where Superteams.ai comes in.
We provide fractional AI teams that help companies get started with AI quickly — without the cost and delay of building a large in-house team. Whether you need to prototype an autonomous reporting agent like the one we’ve just walked through, integrate AI into your existing analytics stack, or explore new automation opportunities, our experienced AI engineers, data specialists, and solution architects can get you from concept to live deployment in weeks, not months.
Instead of spending months hiring and experimenting, you get a ready-to-go team that’s already done it — with the technical depth to build robust, secure, and scalable AI systems from day one.
If you’re ready to move from reading about AI to deploying it in production, visit superteams.ai and let’s start building your first (or next) AI solution — fast.

-Feature-Image.CjBFdO7y_Z1bTNvg.webp)